Friday, February 15, 2013

Up we go!


Since we now have a model, however mediocre it may be, of tier one battles, let's extending it to add in tier two tanks. This shouldn't be too hard, tier one and tier two tanks fight each other a lot, so I went ahead and pulled a data-set of all battles featuring exclusively tier 1 and 2 tanks. That, by the way, is over 8000 battles

The first thing to look at is the Match Maker. First let's look at the distribution of numbers of tier 1s and 2s:
It's symmetric, which means I didn't mess up this time

First things to notice: There are no battles where tier 1s participate with less than 12 total tier 2s, 6 for each side. Second, it is MUCH rarer for a tier 2 tank to get into an all tier 2 battle than for tier 1s to be in all tier 1 battles, just as we would expect. Third, battles where there are more tier 2s on one side than the other don't occur infrequently, but they are rarer than equal numbers on each side (look at the odd numbers).

So, that's interesting, but what about the distribution of battles that Tier 1 tanks get? Let's count the number of Tier 2 tanks and see what we find:

I have more charts where that came from!
So, firstly, ~43% of the time a Tier 1 goes into battle, it will only see tier 1 tanks. The rest of the time at least a third of the tanks in the battle will be Tier 2 tanks. Now, as I mentioned above, the teams aren't always 'fair', in fact 26% of the time, there will be more Tier 2s on one side than the other. That's not terrible, most of it can likely be attributed to platoons.

Another interesting item I found, which at first confused me, is that Tier 2 Artillery can get into battles where all the tanks are Tier 2. In all 1308 battles where there are only tier 2 tanks present, this happened only 4 times. The obvious answer is that these are actually battle tier 3 battles which happen to be missing tier 3 tanks, but the amusing part is that it can happen.

To continue on down the road, I'm going to use the tier one model we put together last post to get a first look and see how well it matches our data. If you don't remember, this is what that model looked like:

TankOdds Ratio
Leichttraktor
1.0239
T1 Cunningham1
MS-10.9495
Renault NC-310.9181
Renault FT-170.9096
Vickers Med. Mk. 10.8563

Unsurprisingly, this model doesn't perform all that great on the new data, even when limited to battles that include Tier 1s, only correctly predicting 52.2% of the the outcomes, compared to 51.6% for just choosing side 1. So, obviously, it's back to the drawing board to come with a new model, one that takes into account the new data. The model I'm going to try is going just contain the non-premium tanks, so we won't need a baseline.


Quick check to see if this makes any sense and... Hmmmm. The worst tank, by a long shot, is the Med Mk. II, a tier 2! I suppose that's not unsurprising, we've previously said that British low tiers suck. The fact that the Mk. II is actually 3% worse from the Mk. I is also highly amusing. Worse, the bottom three tanks are all British.

At the other end of the spectrum, the obvious is made evident, the 'derp' T18 dominating the low tier battles, followed by the venerable Pz. II. The difference though is quite immense,

The three 'classic' Tier 1 tanks also place higher than quite a number of tier 2 tanks. The LoLTraktor once again tops the list with the T1 and MS-1 close behind, likely due to the number of experienced players running them for fun and credits. In fact, some of the T18's power may derive from similar sources, though the 75mm seems to be the main cause.

But naturally, if we can't predict much, this isn't worth much. So, of the 8453 battles, it's important to note that this model only predicts 4658 of them, just 55.1%. The null model, just guessing a Side 1 Win, can predict 51.8%. That's an improvement sure, but not much.

At least the Trend is in the right direction

Obviously, we're showing that the choice of tank is not the biggest factor in whether a team wins. Personally, I expect we could get a lot of extra predictive power from knowing how many battles players have. It's likely that the experience of playing for a long period of time allows you to do much better against the 'noobs'. While I can't exactly vouch for a skill-based match-maker, I think that this is a perfectly good time to suggest that players with less than, say, five-hundred or a thousand battles be segregated into their own matchmaking pool for their own protection and enjoyment of the game. At least for the first couple of tiers.

For the next post I'm going to add in the low tier premiums to see if we can improve our predictive powers. Hopefully this time it won't be a week and a half between posts. After that I am going to try to tackle high tier tanks, since those are what people actually care about. By then 8.4 will likely be out and my data will be woefully out of date, so we'll go forward with obtaining more data and taking a look at how that huge 183 changed the meta game.


As always, if you enjoyed this post, please help us in our data gathering efforts. It's simple, it's easy and you can find out how just by clicking here.

Friday, February 8, 2013

A Slight Deviation for Damage Stats

Update Notice: Overlord has said that 2.5 Standard Deviations is the cut off. Edits in Bold have been added to reflect this.

As you may know, it ALWAYS feels like you're getting min-damage rolls. And the funny thing is, you're not entirely wrong. A few people have been making posts on the forums and the subreddit talking about the cause of these issues. Since the intent of this blog is to delve into the basic stats the biases of the game, I figured that this would make a good post.

If you understand the way that the Damage and Penetration (and even the aim-deviation) RNG works, it makes a lot of sense that you would see a lot more minimum damage rolls than you would expect. If you're looking for conspiracy theories, you might even think that this is done on purpose.

If you've been paying attention, you know that Damage and Penetration values vary +/-25%. If this was a uniform distribution of values, the chance of getting any damage value would entirely dependent on your mean damage. The probability of each integer damage value X would be, given a mean damage D, simply:


For a 100 damage gun? P(X) = 1.9% for any damage value between 75 and 125. A 200 penetration gun?  P(X) = 0.9% for any damage value between 150 and 250.

Now, that would seem like an easy, logical choice of a random value scheme. In fact, it's actually rather computationally "cheap", which leaves me confused by this next part:

That's not what Wargaming did. Wargaming decided that they wanted to concentrate the damage values around the average, but still provide a degree of randomization. To do this, they decided that the damage (and penetration) values should be pulled from a normal distribution, but limited to a range of 
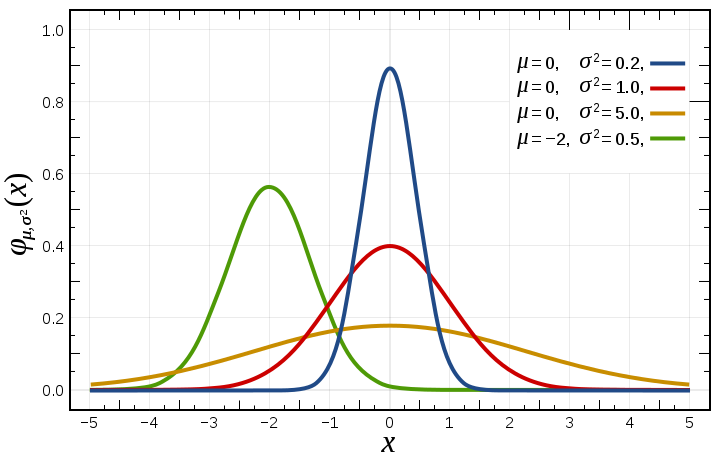
values +/- 25% from the mean. Now, in case you don't know what a normal distribution looks like, Wikipedia provides a nice example of 3:

I certainly didn't make this, but I could have. I think.

The so-called 'Standard Normal'  (doesn't that sound redundant?) distribution is shown in red. It has a Mean of 0 and a Variance of 1. The important thing about this guy is that you can take any other normal distribution and convert it into a Standard Normal distribution with some simple calculations. Further, because of difficulty of integrating an arbitrary normal distribution, there exist standard tables of values, called Z-tables, for calculating what percentage lies under parts of the curve.

Okay, that's all well and good, but what does that tell us about are damage values? I swear I'm getting to it. One additional property about the normal distribution is important: It extends from -∞ to +∞. That means that in order to limit the variation to +/- 25% of the mean, you have to set some hard cut offs. The way Wargaming did this was to say "If we get a value below X, we'll just call it X. If we get a value about Y, we'll call it Y." What this did was to take all of the probability that was below X and give it to X and similarly take all of the probability above Y and give it to Y.

The white areas would be the probabilities rolled into Min and Max values
Now I come to a bit of a conundrum, there is a hidden parameter here that we don't know. Where we know the mean damage values for each gun, we don't know what values Wargaming has chosen for Variance (Edit: Overlord has mentioned that it is a 2.5 Standard Deviation Variance). Since Variance determines how flat or pointed the distribution is, we can't say exactly what proportion of hits should be minimum damage. However, by choosing some logical limits, we can give a good idea of what it should look like.

The obvious choices for the +/-25% limits are at the 1, 2 and 3 standard deviation lines.

Cut Off (#SDs)% Min Value Hits
1
15.8%
1.5
6.68%
2
2.2%
2.5
0.6%
3
0.1%

Obviously, one can pull those values off the standard Z-tables. For each of these cases, we can determine the standard deviations of the distributions of based on each gun's damage. It's a pretty simple equation:

(Mean Damage)/(4*#SDs)= Damage Standard Deviation

There is one final question to be answered, how much more often do these extreme values occur than any other value? To answer this, I'm going to find the ratio of Minimum damage hits to Mean value hits. I'm going to assume that WG rounds fractions to the nearest integer, so the 'Mean' damage hits actually occur in when a value +/-0.5 from the mean is selected.
   
Gun TypeMean Damage1 SD2 SD2.5 SD3 SD
76mm M1A1
115
11.38
0.793
0.173
0.024
88mm L/56
220
21.78
1.516
0.3315
0.0459
105mm T5E1
320
31.68
2.206
0.48
0.0668
122mm BL-9
390
38.61
2.688
0.588
0.0815
130mm S-70A
550
54.46
3.791
0.822
0.1149
155mm SA 58 AC
850
84.177
5.8589
1.27
0.1775
170mm PaK46
1050
103.9
7.237
1.579
0.219

EDIT: It has come to my attention that Overlord has clarified that the +/- 25% is a 2.5 Standard Deviation limit.

Added Damage Distribution Charts: All Y-Axis Scales are the same for easy comparison.


88mm L/56 Damage Distribution
76mm M1A1 Damage Distribution
Since the mean value is supposed to be the most likely roll, it will always be more likely than any other roll (by varying amounts). The interesting part though is the trend. As your average damage goes up, these extreme values (Min and Max rolls) increase in proportion.

If we go with the 2 Standard Deviation case , the one I find to be most likely (Particually since I remember WG saying that the aim circle was the 98% line), you'll see that a Jagdpanzer E-100 will see a min or a max damage roll 7.2 (1.58 2.5 SDs) times more often than they will see any other number! More typically armed high tier tanks will see min or max rolls 2-4 times more often (Half to 80% as often) as any other number, and all tanks with average damage greater than ~140 will see minimum and max rolls more often than average rolls.
170mm PaK46 Damage Distribution

120mm M58 Damage Distribution

Keep in mind though, for the 2 SD case, that Minimum and Maximum rolls will still only make up 4.4% of the total rolls we see. For the 2.5 SD case, they would be 1.2% of all rolls. But they are more likely than any OTHER most other specific values, especially those a bit removed from the mean, so they will seem to show up a lot (plus, how many people remember how often they hit for 159 damage? There is a bit of a confirmation bias effect going on here too).

As for Max damage rolls, there is one additional reason we see less of them than Min rolls: Low Health Tanks. When you hit a tank that has hitpoints less than your Max damage, you have a chance, dependent on their health, of wasting a roll higher than their health to kill them. If you compile all of your shots over a number of battles and don't drop kill shots, you'll find that your average damage per shot is lower than the gun's mean damage due to this effect reason.

Now, if we had a data set to help us determine the rule WG uses to truncate their random numbers, we could figure out just how badly off my assumptions are! I'll see about getting Xylenes to get some data on that...


As always, if you enjoyed this post, please help us in our data gathering efforts. It's simple, it's easy and you can find out how just by clicking here.

Monday, February 4, 2013

Technical Difficulties

To those of you who keep checking this blog, thank you very much. I hope to have a new analysis up in the next couple of days, but I have been having some computer issues, so it's taking much long than expected. Thanks for your patience and support.